


Modeling Strategic Levers with DoWhy and Python
What causal inference can teach us about decision-making in sustainability-driven markets.


When I was in high school, everyone was competing to be the coolest kid.
Some did it with music, others with clothes, or grades, or parties. We all looked around and tried to win. This was the game: dominate the social landscape, be the best and one-up all our friends (or whatever we thought true friends were).
Then came adulthood. And suddenly, no one was truly cool anymore.
Everyone was just… different. I found myself in teams where everyone had a vastly different background and skillset from another. The challenge wasn’t so much “who’s better” because how should one even measure that? It was more about how we can bring everyone to speak a common language so that we can build something awesome together.
Essentially, the dynamics shifted from competition (“who’s the coolest kid on the block”) to contribution (“how can we build something awesome all together?”).
It’s not like this in every workplace; I know that I’m quite privileged to find myself in such settings. But I do believe that this is the future.
It can’t be about how loudly you shout anymore, or about how many likes you get. The new game is about what you bring to the table that no one else can. Not to be better than anybody else, but to build something together that no one person on the team could have even dreamed about all alone.
The general vibe is less about “wow, look at all these rotten eggs, I’m the freshest of them all” and more “oh wow I’m an egg and this other person is flour and this one is sugar and… wait a minute, we can bake a delicious cake!” That’s not to say that you can’t be the freshest in a carton of eggs. But that at some point you might want to leave your carton to fulfill your purpose on this world.
I hope you bear with this admittedly weird introduction, because this is the point I’m trying to make: Strategy today is less about “how can I make sure I’m the best” and more about “what’s my unique contribution?”
I’m a quant, so I like to figure this out with lots of math or at least some code. Figuring out what makes me or my business unique, however, is not the easy kind of problem you can solve with a linear regression. In fact, it took me almost a year after creating my company, Wangari, to realize that I’d been using the right methodology all along back in my particle physics days.
To figure out what makes you unique or why you’re unique, the best approach I’ve found is causal inference. Bluntly speaking, this means figuring out not what’s going on but why things are the way they are.
I’d used this indirectly during my PhD to figure out why some models of the universe were working out and others were clashing with experimental data. We won’t dive into physics in this post, I promise—but I’ll show you with a hands-on example how this translates to business strategy and how data scientists, analysts, investors (and frankly all kinds of folks who know a bit of Python) can use this pretty easily.
Managers Want Dashboards. Strategists Need Logic.
In most organizations, managers, investors, and executives want one thing: metrics. They’ll ask for fancy dashboards and KPIs to answer the question “what’s going on right now?” If you ask them why something is happening and they don’t know the answer, they’ll say “let’s hire a consultant to figure that out.”
Which is fine; I’ve literally been that consultant to some companies. But I think I can spare you and your company the expensive fees, if you want. You truly have the capability to figure out why things are happening in a quant way, and it’s not even that hard.
Why things are happening will tell you why you’re unique and which ingredient you are in the beautiful cake we’re trying to bake all together. This applies to individuals as much as to companies. It’s not about domination or grabbing market share, but about intelligent participation.
Setup: Simulating Strategic Levers in a Sustainability Context
Imagine you're a strategy analyst at a manufacturing firm. Your team is testing sustainability initiatives. You’re trying to understand which ones actually lead to long-term growth.
You have three main levers:
L1: emissions_reduction— investing in tech to reduce carbon outputL2: employee_training— internal programs for sustainability awarenessL3: circular_design— redesigning products for reuse/recycling
And one key business outcome:
Y: growth— long-term revenue growth
There are also external factors influencing both your levers and outcomes:
consumer_sentiment— how much the public cares about sustainabilityregulatory_pressure— how strict environmental regulations are
This is the kind of challenge me and my colleagues work on all the time. But instead of doing that work and cashing in nice consultant fees, we want to empower you to do this yourself. (Although we won’t say no to a nice consulting mission to help you get started or to dig deeper than you can yourself, obviously!)
Let’s start by simulating a dataset that reflects this system. If you can get real data from your company (legally), so much the better—just use that.
The core idea is to treat strategy as an intervention in a complex system. Like when a hunter shoots a deer in a forest: He knows that shooting it will have knock-on effects for the trees, the rabbits, the moss, etc. (Whether or not killing animals is great for sustainability is not for me to judge.) The point is, it’s an intervention with many consequences that we’d like to measure, not just a regular old business plan.
Here’s how we translate all that into a Python script:
import pandas as pd
import numpy as np
from dowhy import CausalModel

np.random.seed(42)
n = 1000

# Confounding factors: shape both decisions and outcomes
consumer_sentiment = np.random.normal(0, 1, n)
regulatory_pressure = np.random.normal(0, 1, n)

# Strategic levers: influenced by confounders
emissions_reduction = 0.6 * regulatory_pressure + np.random.normal(0, 1, n)
employee_training = 0.5 * consumer_sentiment + np.random.normal(0, 1, n)
circular_design = 0.4 * consumer_sentiment + 0.3 * regulatory_pressure + np.random.normal(0, 1, n)

# Outcome: long-term revenue growth, shaped by everything
growth = (0.7 * emissions_reduction +
          0.3 * employee_training +
          0.4 * circular_design +
          0.5 * consumer_sentiment +
          0.4 * regulatory_pressure +
          np.random.normal(0, 1, n))

# Build the dataset
df = pd.DataFrame({
    "emissions_reduction": emissions_reduction,
    "employee_training": employee_training,
    "circular_design": circular_design,
    "consumer_sentiment": consumer_sentiment,
    "regulatory_pressure": regulatory_pressure,
    "growth": growth
})
We’re modeling each variable around a Gaussian curve, which is the way many datapoints tend to be distributed in nature. We’re also giving a very naive description of business growth; this is obviously a hypothesis and if you have real data about your business growth you should absolutely replace the growth formula by something grounded on real data.
Now, every lever and outcome is shaped by the world it lives in. It’s more than Gaussian scatter, even though we can describe it like this mathematically, because the “best” lever depends on context. That’s why correlation isn’t enough—we need to understand what causes what.
The good news is, we can do this on this dataset.
Defining a Causal Model
First of all, we must figure out what might cause what. Like a scientist, we’re developing a hypothesis. We can then go ahead and test that hypothesis with the data we have.
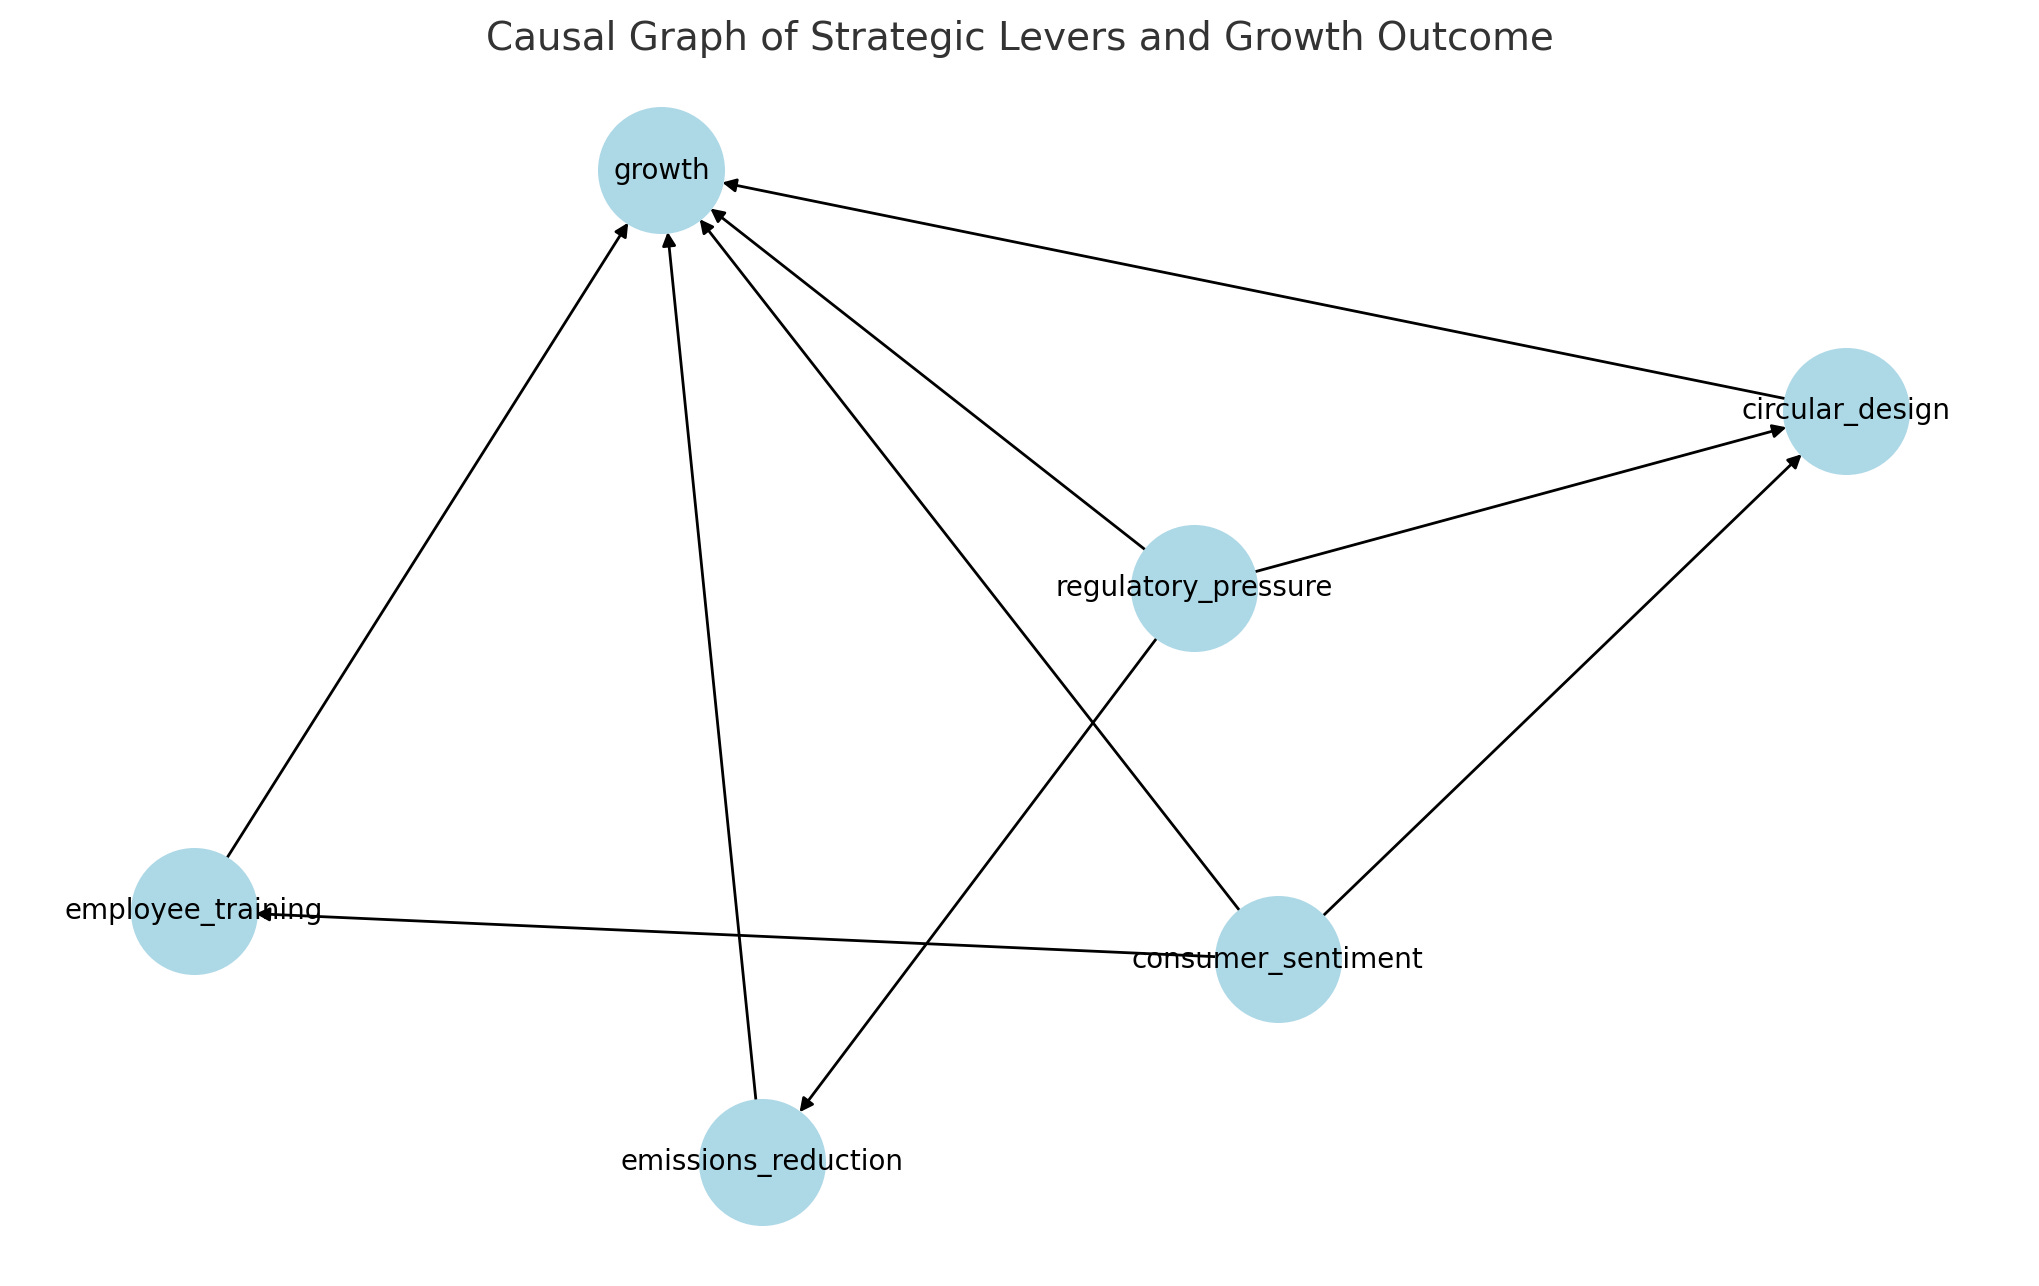
A great way to encode our assumptions is with a causal graph. There are many different ones, but the simplest is called a Directed Acyclic Graph (DAG). A DAG tells the DoWhy framework what we believe about the structure of the system.
model = CausalModel(
    data=df,
    treatment=["emissions_reduction", "employee_training", "circular_design"],
    outcome="growth",
    common_causes=["consumer_sentiment", "regulatory_pressure"]
)

model.view_model(layout="dot")  # Optional visualization
This model assumes:
Levers are influenced by confounders, i.e., consumer sentiment and regulatory pressure.
Growth is influenced both by levers and confounders. We’re trying to find out how much the levers truly influence growth.
These assumptions are crucial—causal inference only works if you model the system accurately. This is where domain expertise meets data science. (ChatGPT or Claude work fine for simple models, but at some point you might want to call a human industry expert to help with building your DAG.)
Identifying the Estimand
Now we can use DoWhy to check if a causal effect is identifiable, given your graph and data. There’s a lot of fancy math behind all of this, but for you, dear Python user, it is made incredibly simple:
identified_estimand = model.identify_effect()
print(identified_estimand)
Two lines of code is all we need to give us the mathematical expression that DoWhy will use to estimate the causal effect.
Estimating Causal Effects
We now estimate the causal effect of each lever on growth. Here we use a simple linear regression, though more advanced techniques are available. We use this regression in the context of backdoor adjustment, which is the most common technique to deal with confounders.
estimate = model.estimate_effect(
    identified_estimand,
    method_name="backdoor.linear_regression"
)

print(estimate)
The output of this piece of code is the so-called Average Treatment Effect (ATE) of each lever. In this example, this boils down to:
How much growth increases if you increase emissions reduction, all else equal.
The same for employee training and circular design.
These are not correlations. These are modeled, counterfactual effects. (Counterfactual is a fancy word for saying “what if”—i.e., what if emissions were reduced by 5%, then how much would growth increase?)
Refuting the Estimate
As good scientists, we’re not done when we obtain a pretty result. We need to test how robust it is first, or else our colleagues will destroy our hard work faster than you can say the word “academia.”
Causal claims should always be tested. DoWhy allows simple sanity checks, like replacing your real lever with a placebo. Again, there’s a lot of fancy math behind all of this, but for the average user it’s deceptively simple to use:
refutation = model.refute_estimate(
    identified_estimand,
    estimate,
    method_name="placebo_treatment_refuter"
)

print(refutation)
If your estimate changes drastically with a fake treatment, it’s fragile. You probably shouldn’t present those results at a conference or to management. If it holds up after treatment, your model has teeth!
Insights: What Actually Moves the Needle?
Let’s say we got these ATEs (how much you really get will depend on the data you generated or obtained!):
emissions_reduction: +0.68employee_training: +0.23circular_design: +0.41
Here’s what that tells us:
Reducing emissions has the strongest causal link to growth. Perhaps because it reduces regulatory fines, improves brand trust, or unlocks new contracts.
Training helps, but in a more diffuse way—it probably strengthens culture, but takes time.
Circular design has solid impact—perhaps by improving margins, reducing supply chain fragility, or tapping into new consumer segments.
These results help answer the strategic question:
What should we prioritize to shape a better future—for us and the system we’re in?
And here’s the kicker: you couldn’t get that answer from KPIs or dashboards alone.
If you wondered whether this is all we do at our firm: Nope, but I think that it’s a powerful first step for any business to start working on.
This is just the beginning. You can level up your causal strategy analysis by combining:
DoWhy+EconMLfor machine learning-based treatment effect estimationAgent-based models to simulate feedback loops and heterogeneous agents
System dynamics for modeling long-term scenarios and tipping points
Temporal logic and lagged causal structures to capture time-delayed effects
These are more than academic toys. We use them daily at our firm now because they’re decision tools for a world where strategy needs to reflect real complexity.
The Bottom Line: Don’t Feed Strategy With Facts. Feed it With Logic.
I know how tempting it is to think strategy is about collecting more data, building prettier dashboards, or benchmarking against competitors. Tell me about it! I’ve been all the way there and back again.
But I’ve noticed that, no matter how sophisticated you might dress it up, ultimately it’s no more mature than a high-school popularity contest.
The adult world is interconnected and collaborative. (Or, where it isn’t yet, we should make it so!) And in that world, strategy is not about knowing what’s happening—it’s about understanding why it’s happening.
When you dig into causality, you go beyond KPIs.
You start to uncover your business’s reason for existing.
I mean not just what you’re good at, but what only you can uniquely offer.
Causal inference helps you identify that key ingredient you bring to the table—the one others actually depend on, even if they don’t say it. (Because, again, some of us still play a high school popularity contest where humility makes you quite uncool.)
I believe that we’re increasingly living in a world that’s no longer about outperforming others.
It’s about knowing your unique value so clearly that others want you to thrive—because you make the system better. Because they need you to thrive, because when you do then you bring that missing thing that helps them thrive themselves.
To me, that’s what makes a sustainable business strategy in the 21st century.
Not domination, but contribution.
In quant terms: Not noise or cute correlations, but robust causal logic.
And Python, believe it or not, can help you find it.